Snapdragon
Translating the wonder scientists feel at the frontier of research into a film that makes a broad audience feel it too.
Fifteen Years in the Valley
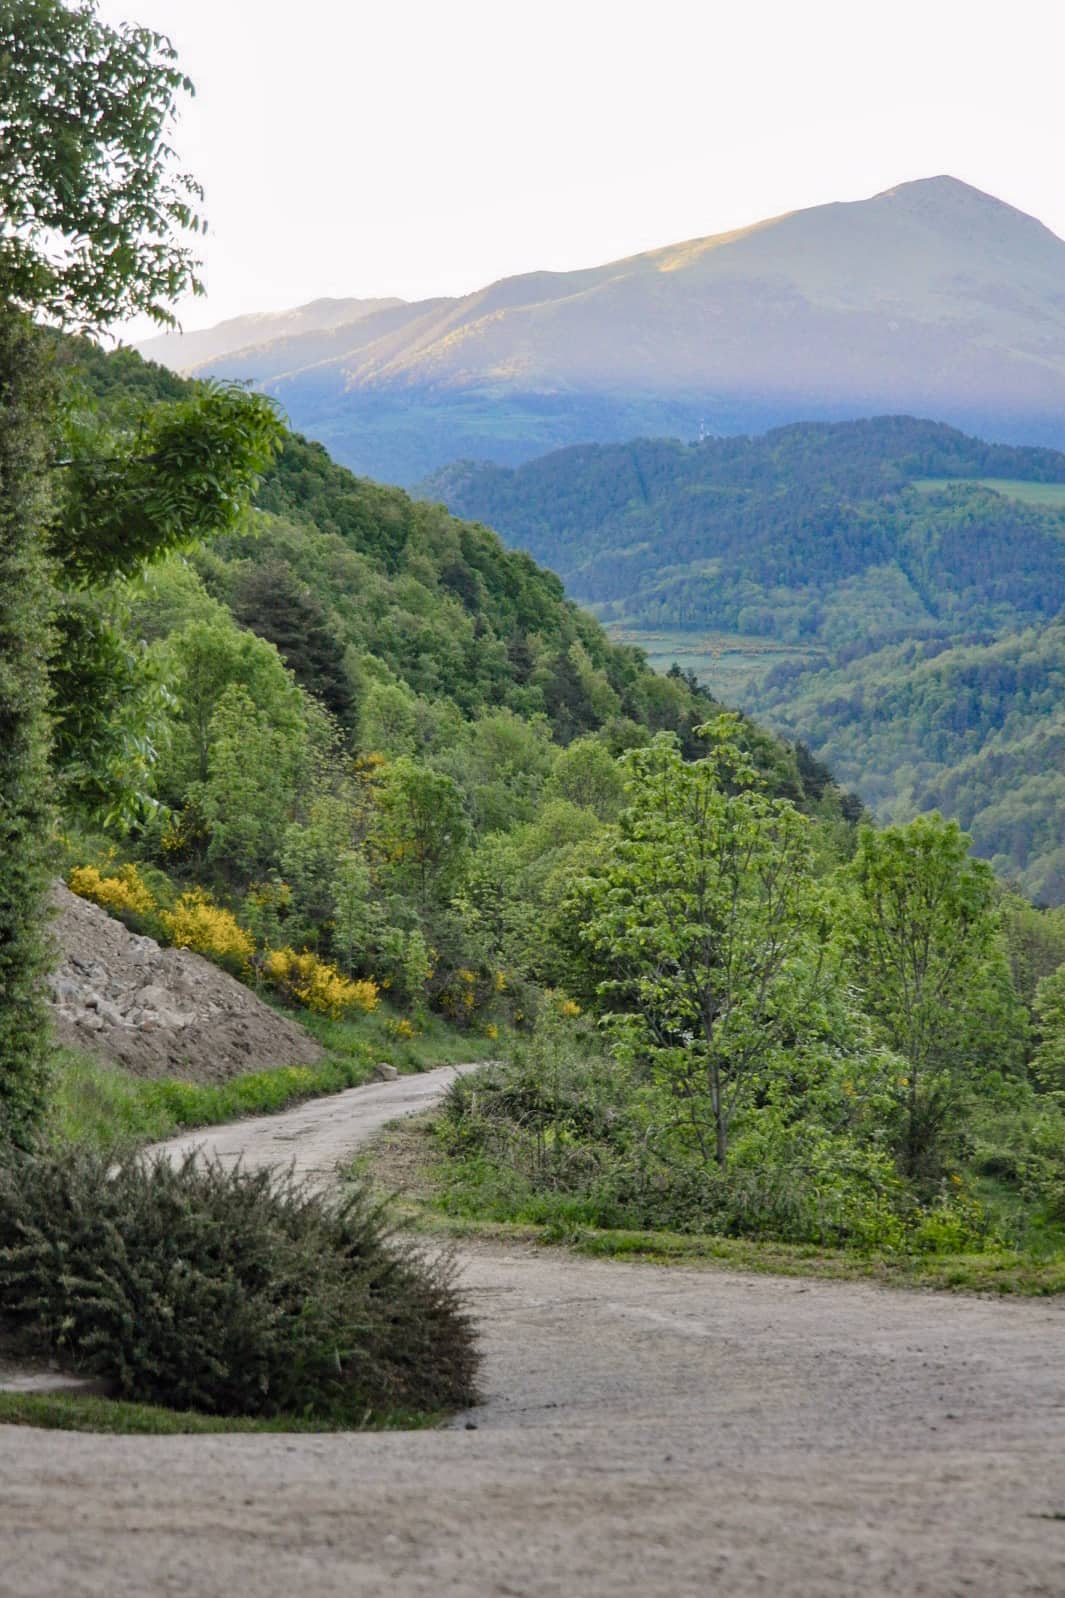
When researchers from the Barton Group at the Institute of Science and Technology Austria (ISTA) pack their bags for the Andorra region each year, they are returning to something close to a ritual. For over fifteen years, Nick Barton and his team have made the journey to the Spanish-French border to find, tag, and document almost every individual Snapdragon growing there. They are following something that genuinely fascinates them. The population holds answers to deep questions about how species form, how genes travel through generations, and why living things look the way they do.
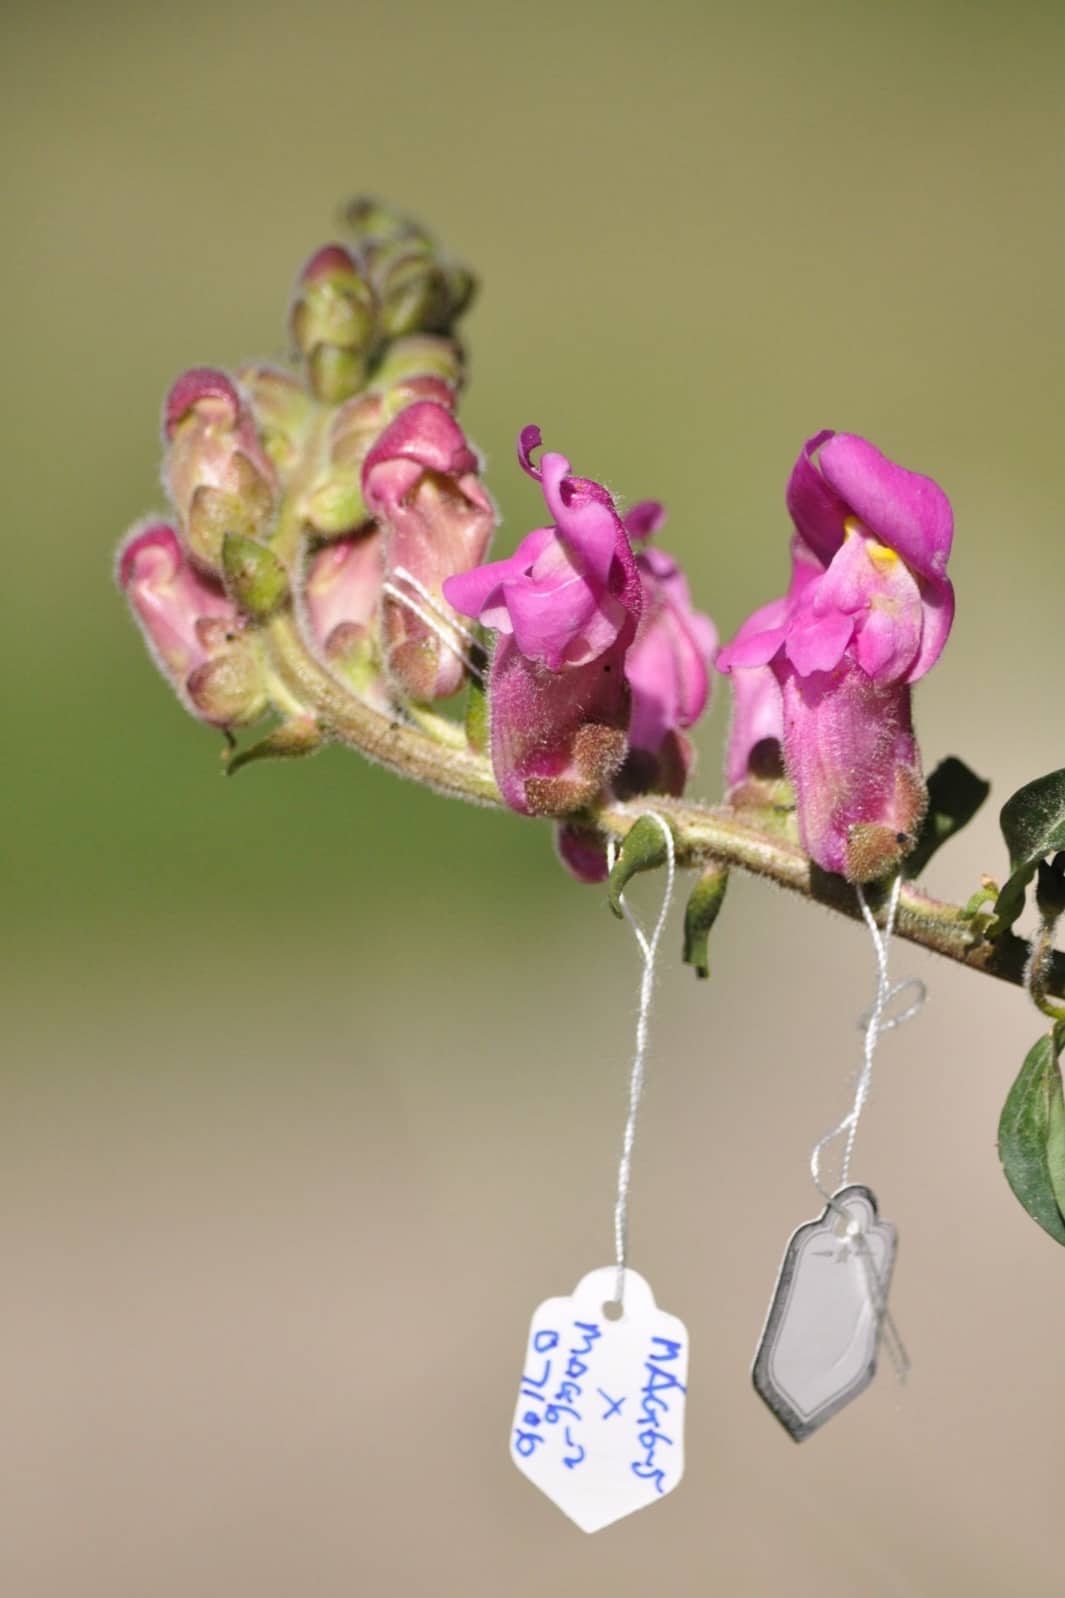
The Snapdragon
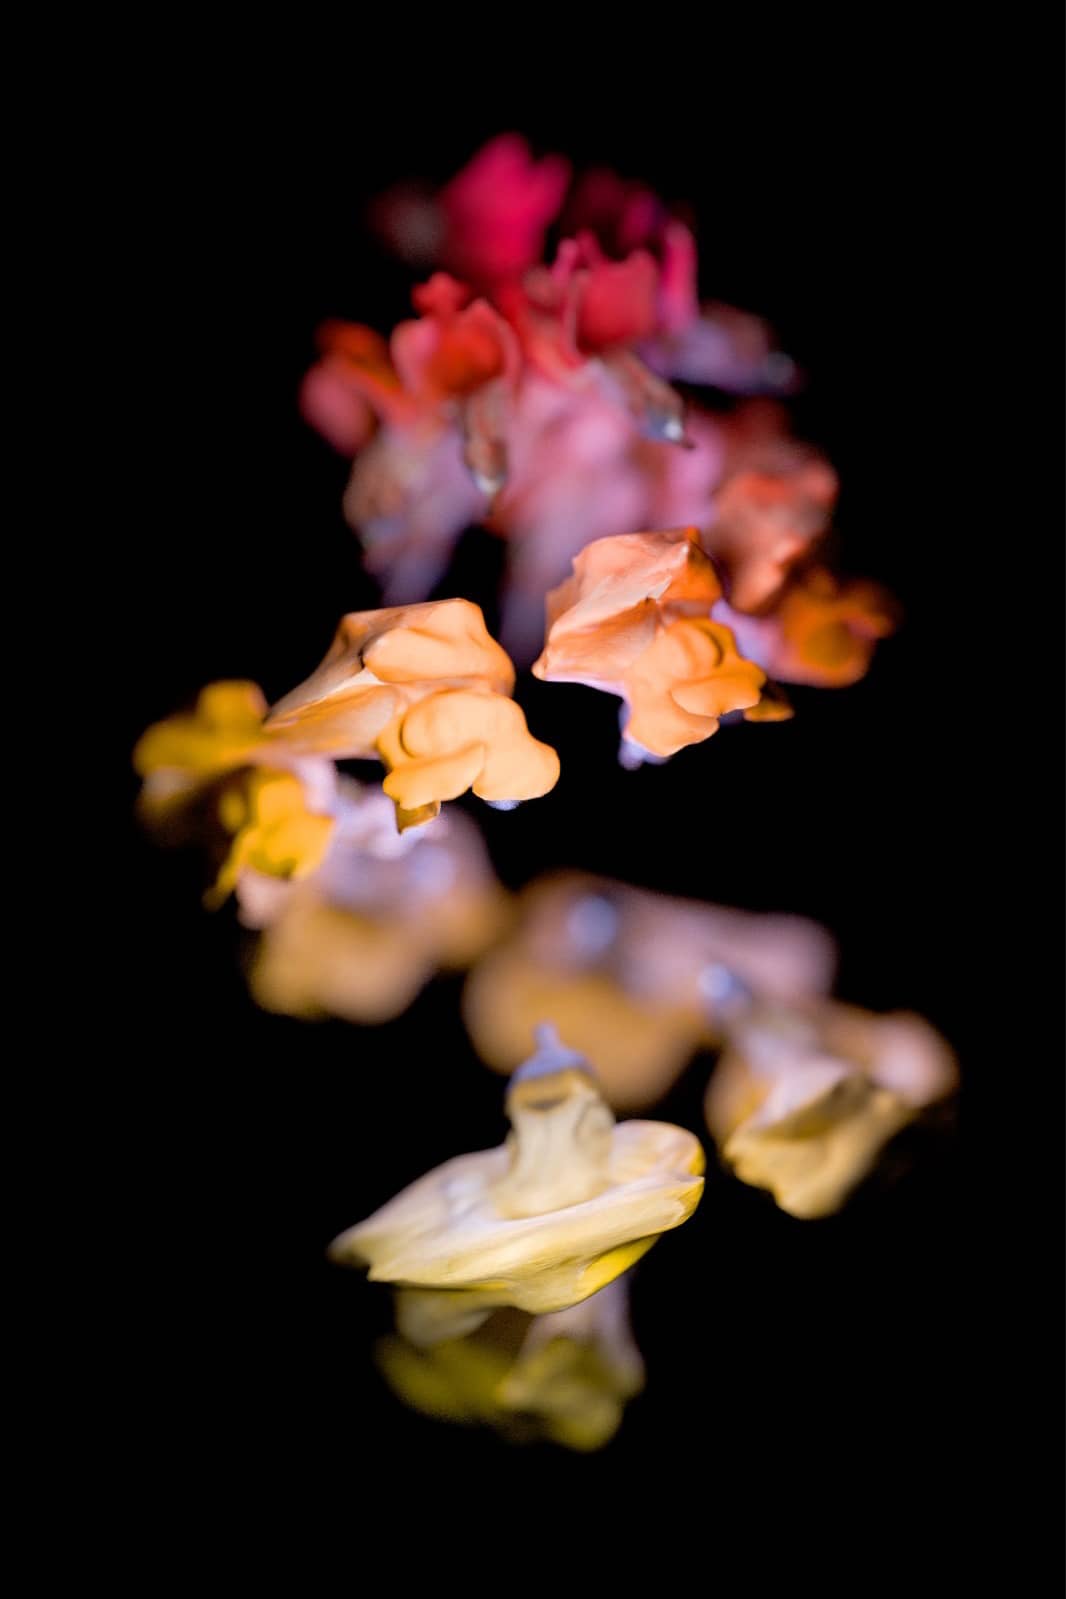
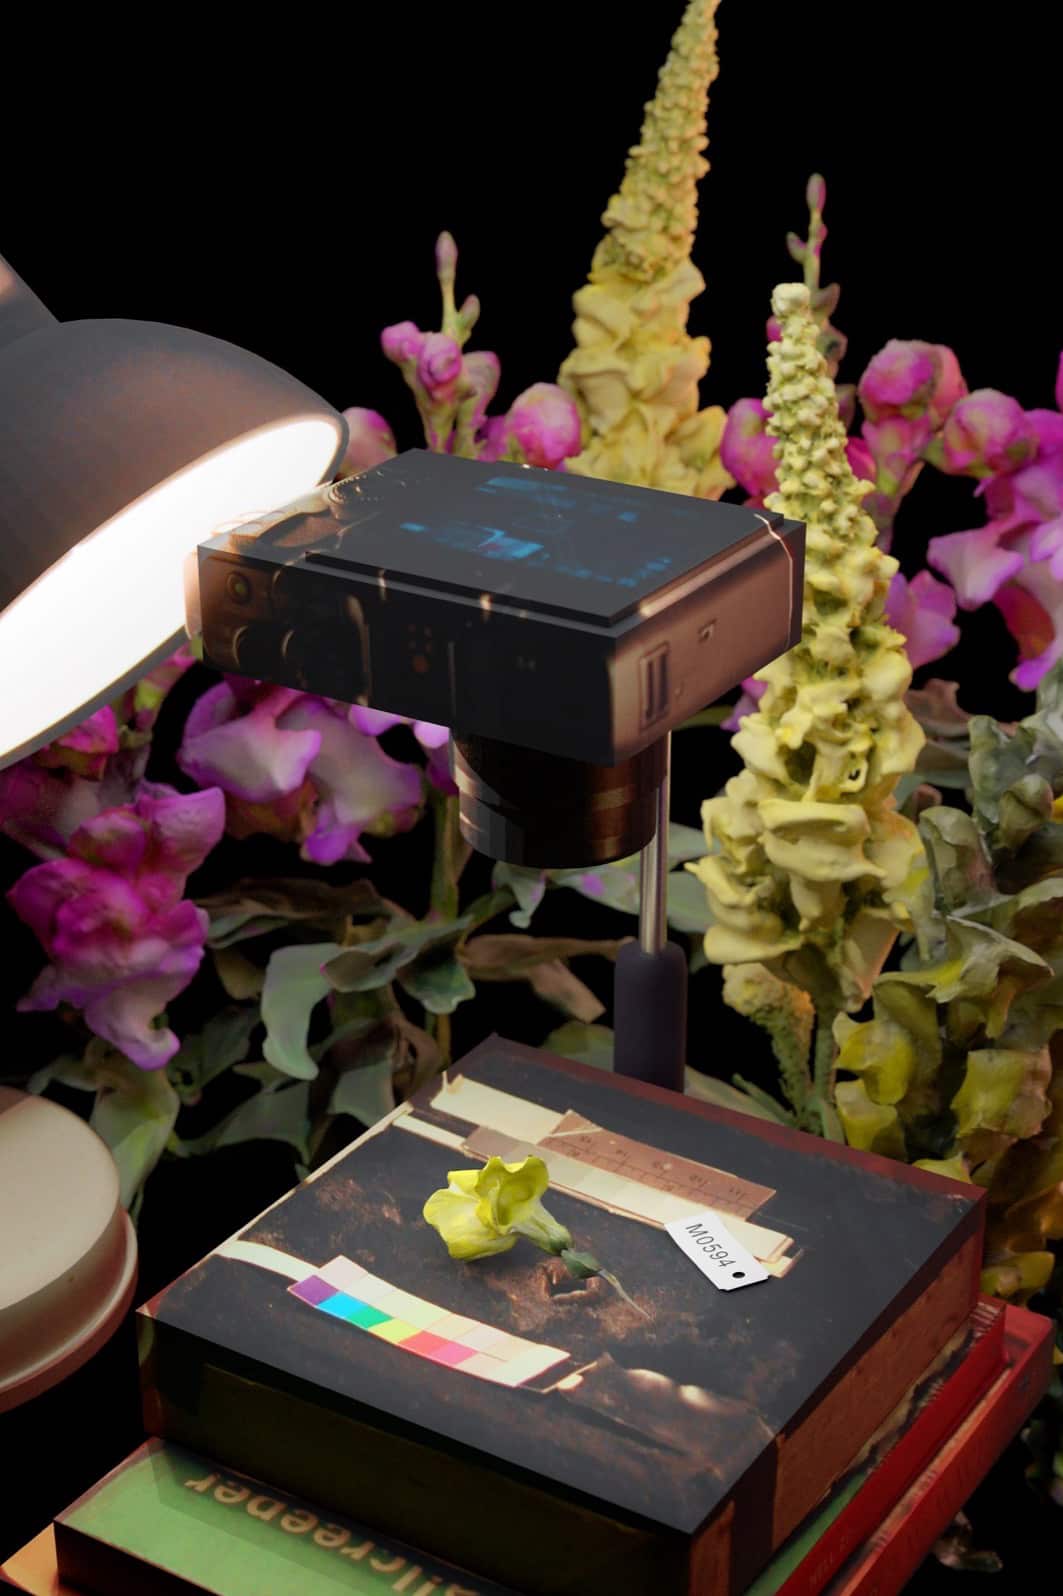
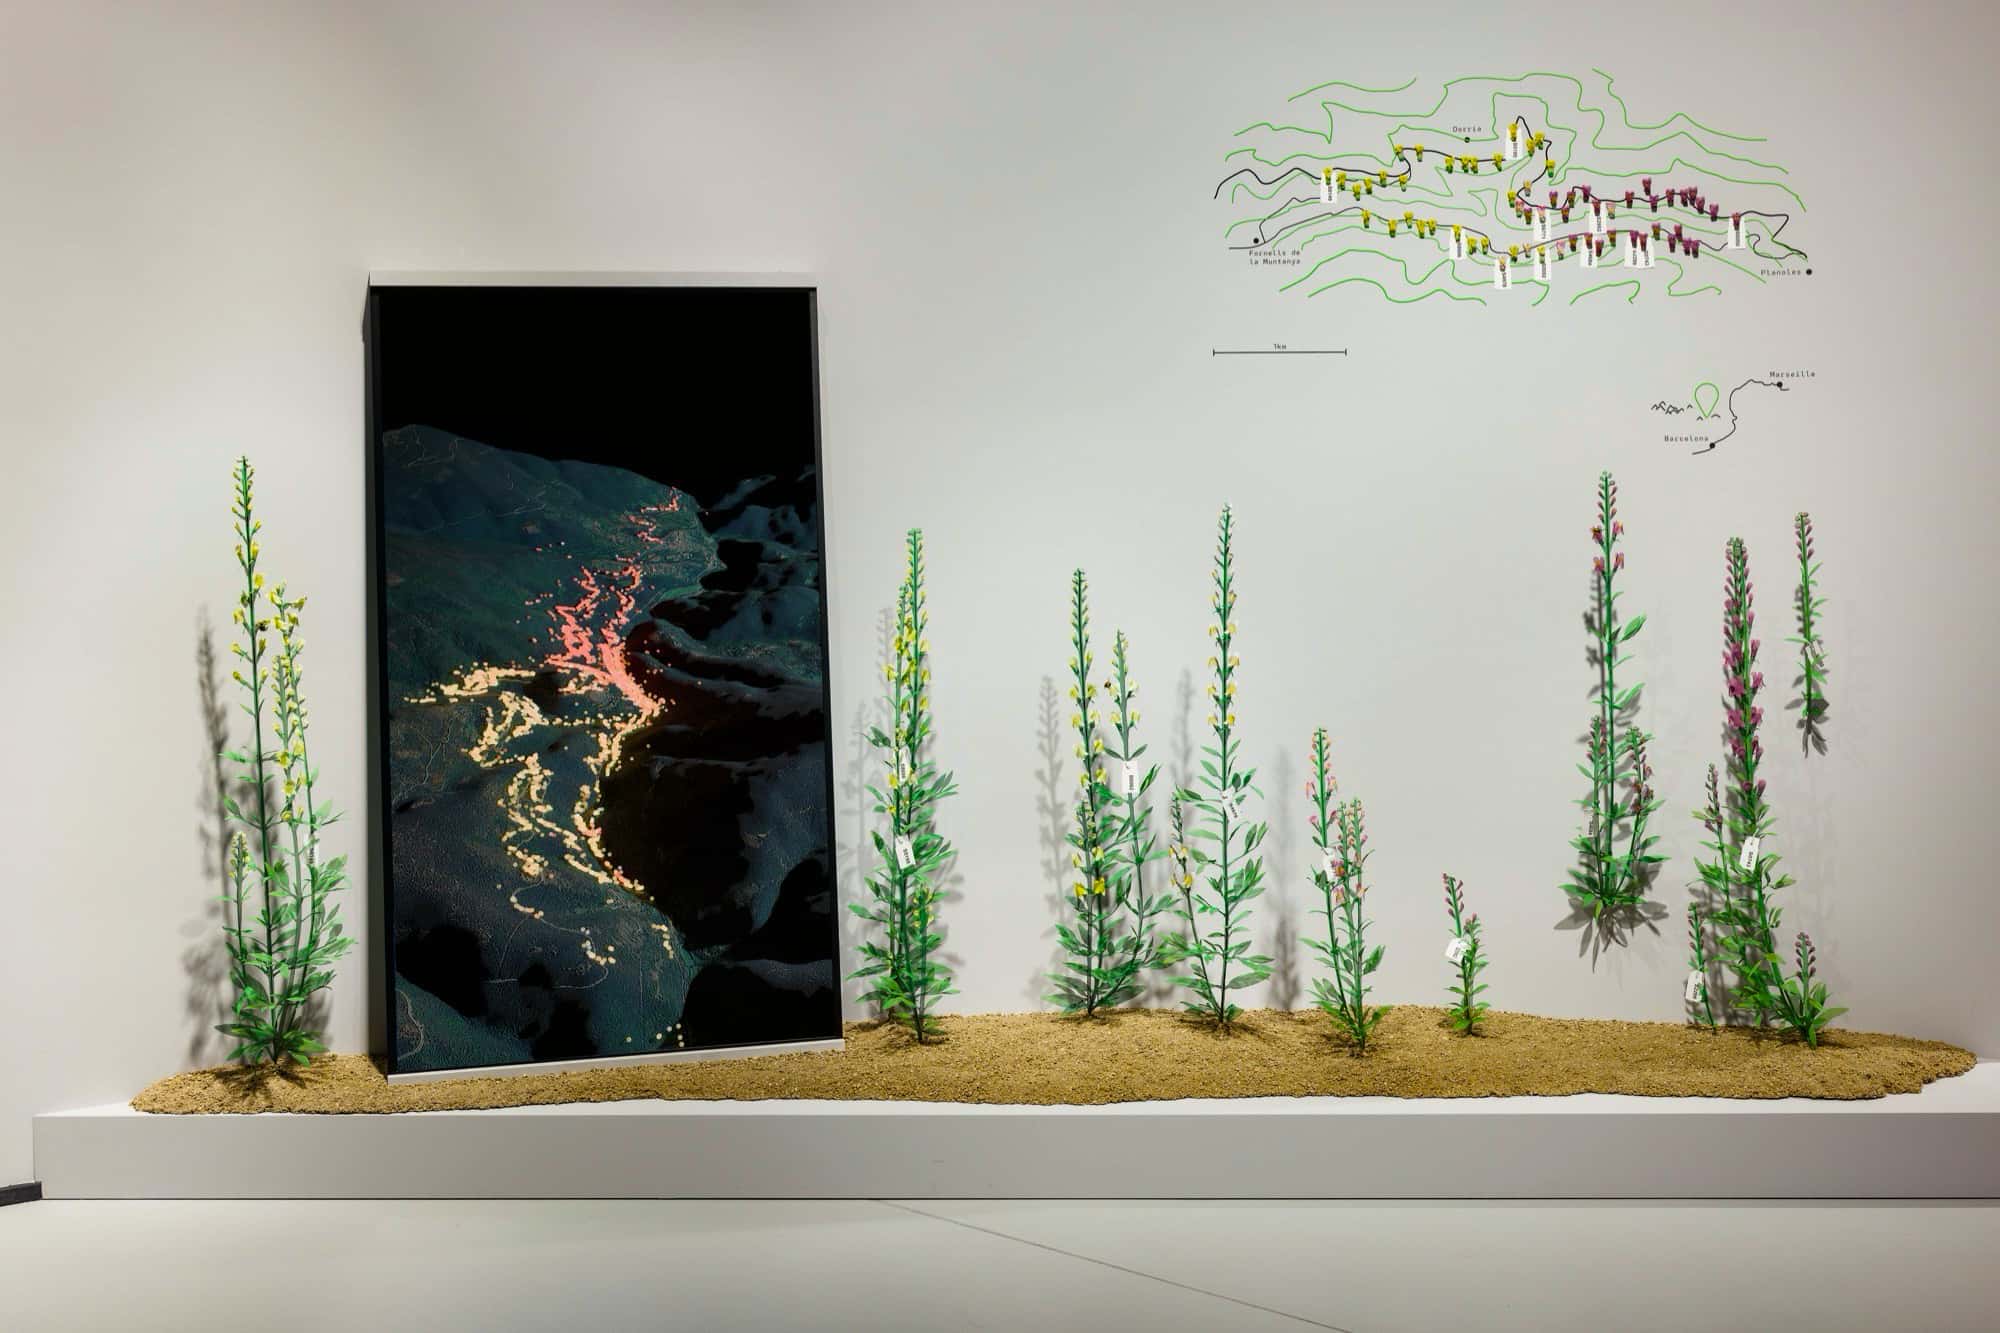
The Snapdragon — also known as Antirrhinum — is not an obvious candidate for scientific obsession. Its blossoms are best known for the way they "snap" open when squeezed, a small theatrical trick that has charmed generations of children. But the Andorra population holds something rarer: a continuous gradient of colour running across the landscape, from blazing yellow in the west to deep magenta in the east. In the zone between them, hybrid specimens paint the hillsides in white, orange, and intricate multicoloured patterns.
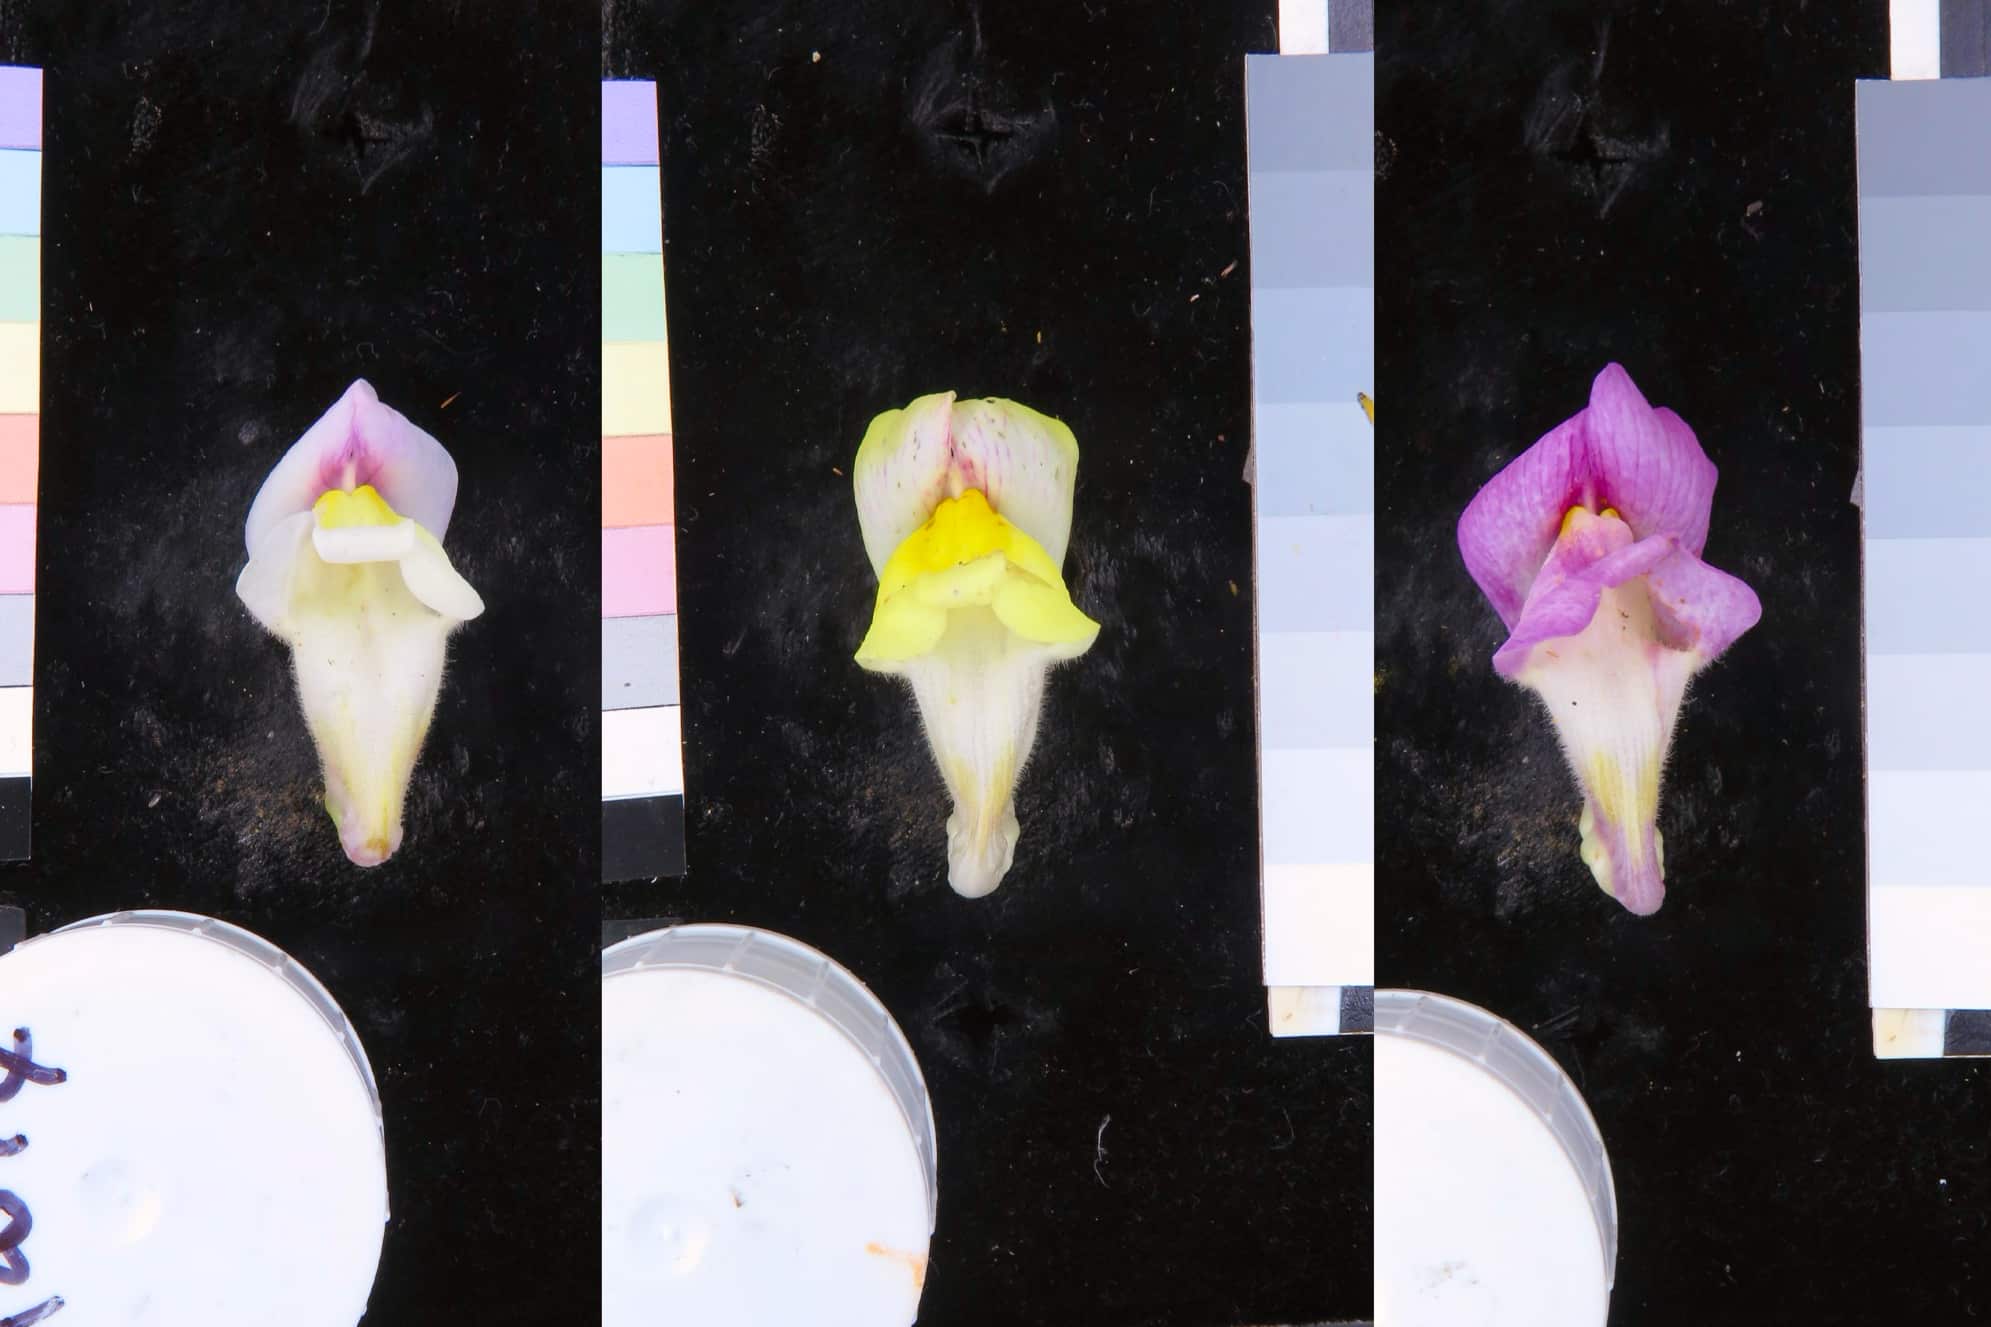
For a geneticist, this gradient is a map. Each colour is the visible expression of specific DNA snippets — called SNPs — competing and cooperating across generations. By tracking individual plants and sampling their genes over years, the Barton Group could read that map: identifying which sequences drive which colours, and what the slow drift of those colours across the valley tells us about the mechanisms of genetic inheritance.
What the scientists feel standing in that valley: the sense that something genuinely important is hidden in plain sight, waiting to be understood. It's not easy to transmit. Their most important tool is a spreadsheet. Their most dramatic output, a pedigree.
Communicating the Craft
The brief was not simply to explain the research. It was to close a perceptual gap — to make a visitor at a science exhibition feel, even briefly, what it is like to be someone who has spent fifteen years caring deeply about a flower.
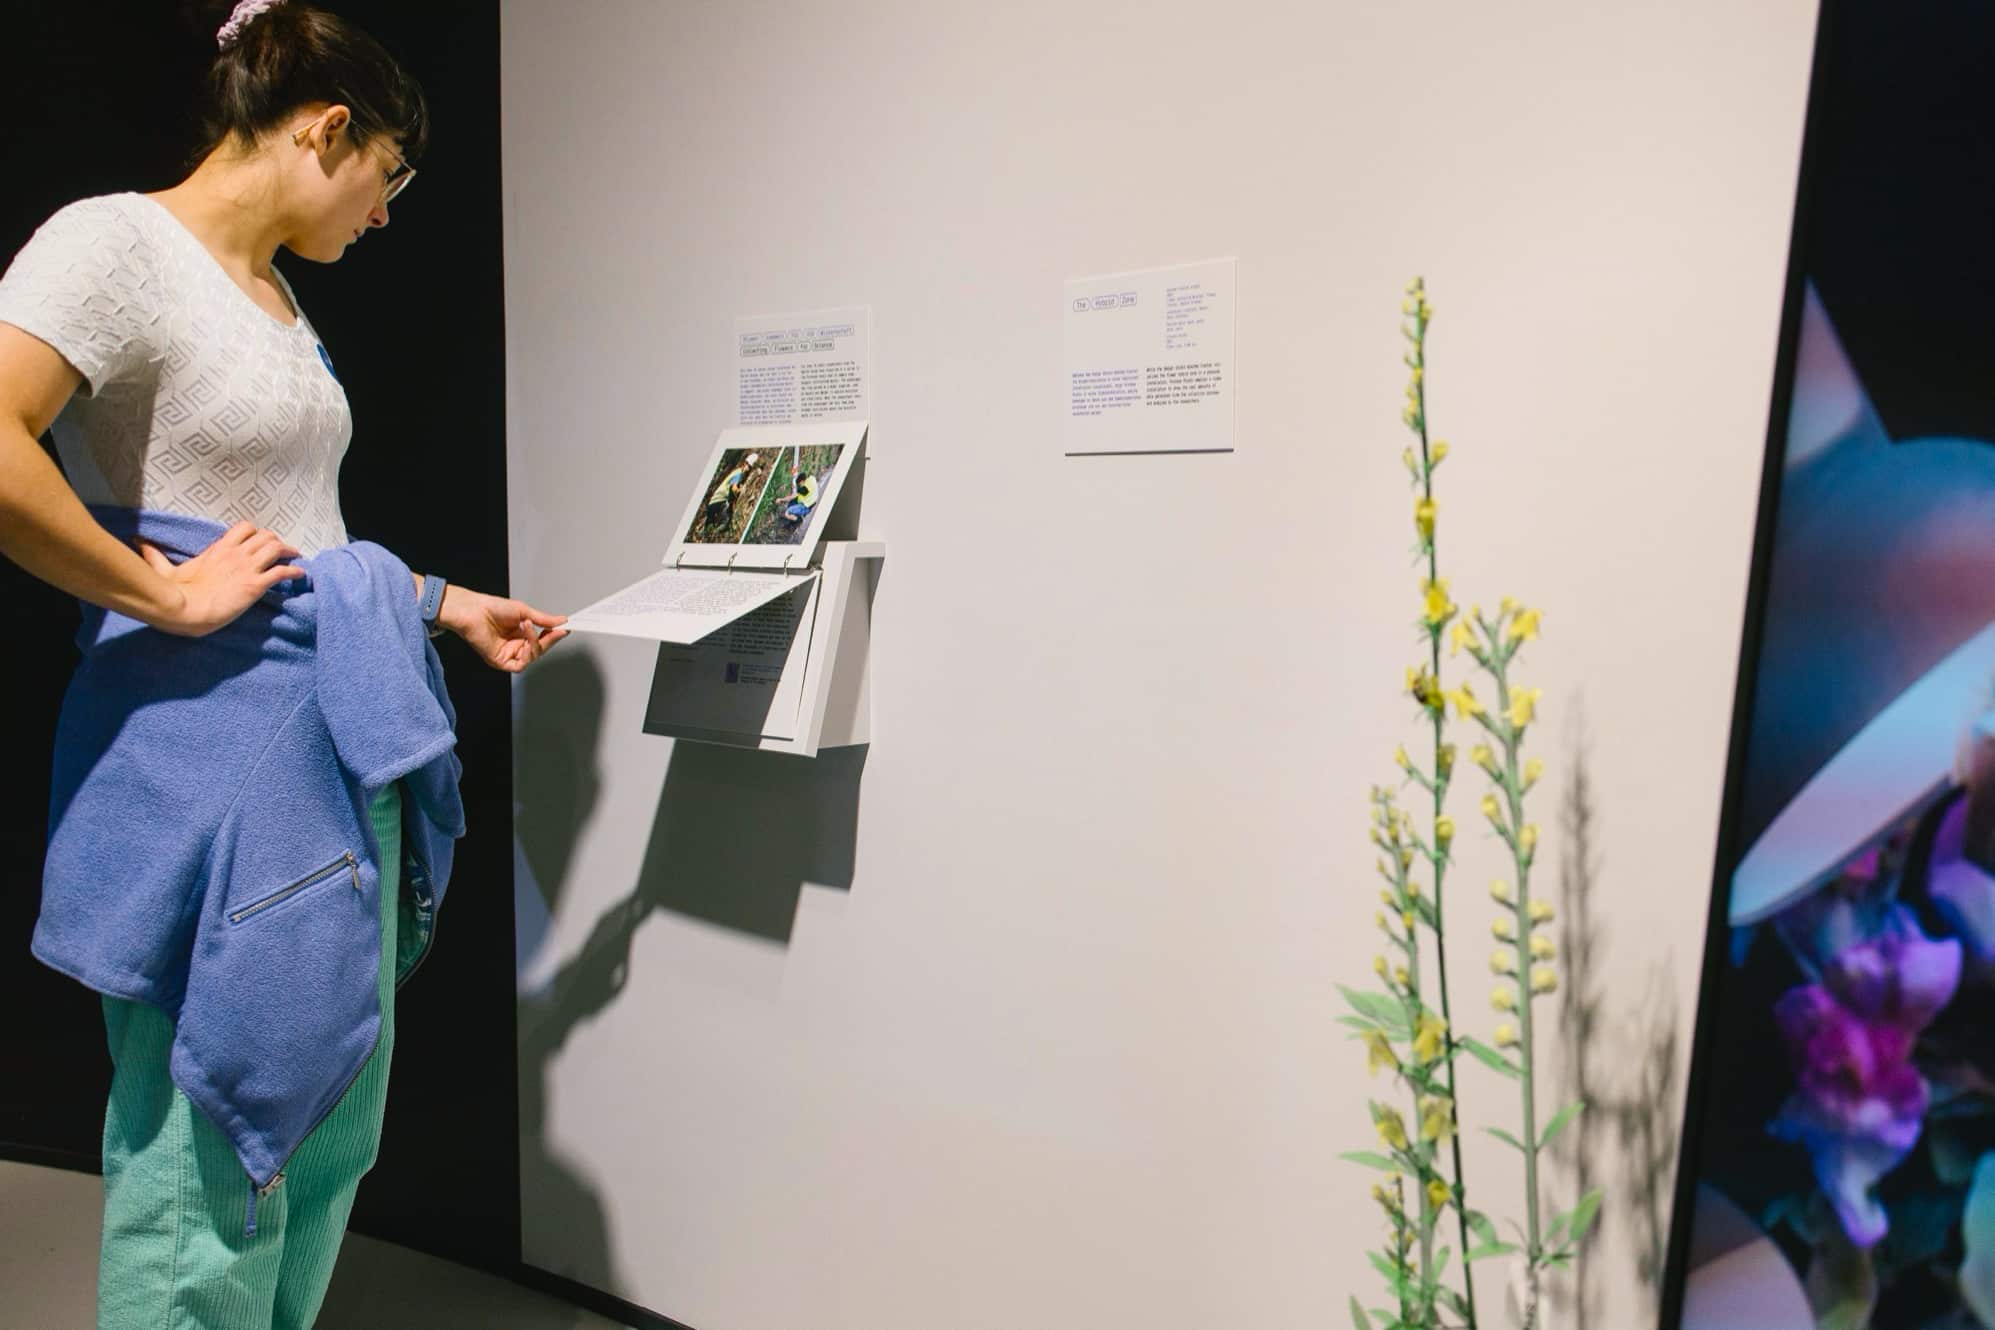
That kind of work is easy to misread as dry. Rows of data, field notes, genetic sequences. The design challenge was to find the visual and spatial language that the data itself cannot supply: the sense of scale, the feeling of pattern emerging from noise, the moment where years of meticulous documentation suddenly resolves into something you can see and feel.
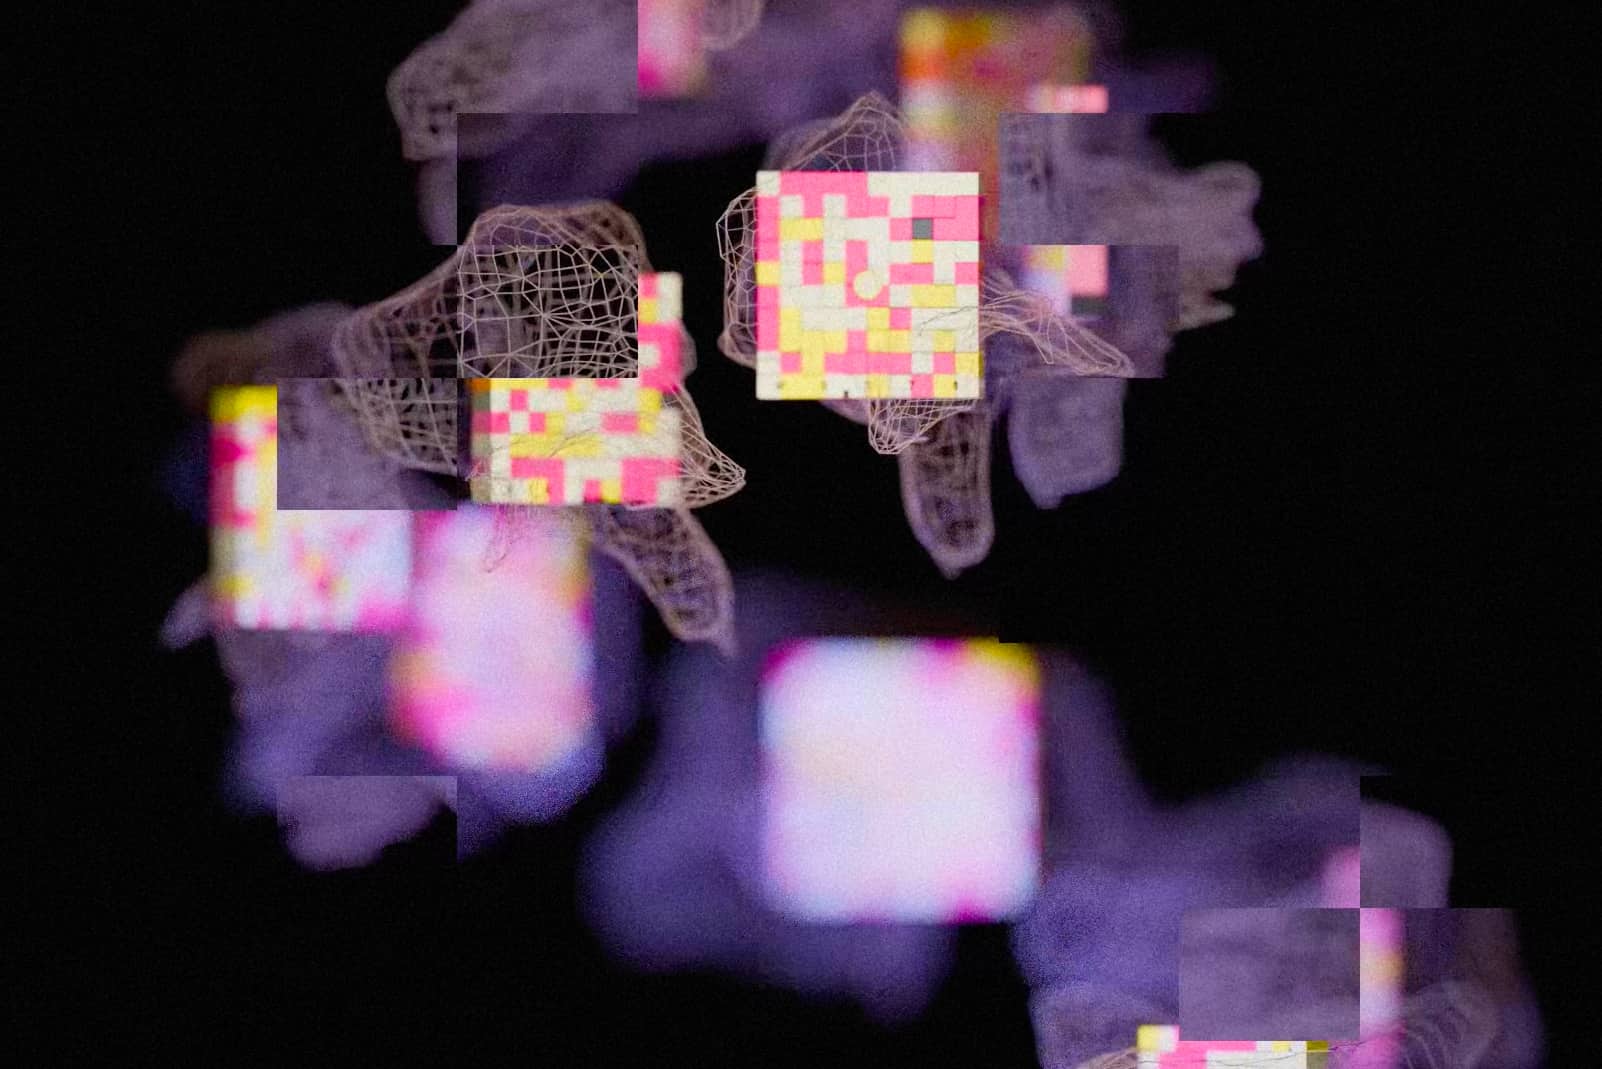
Making the Data Felt
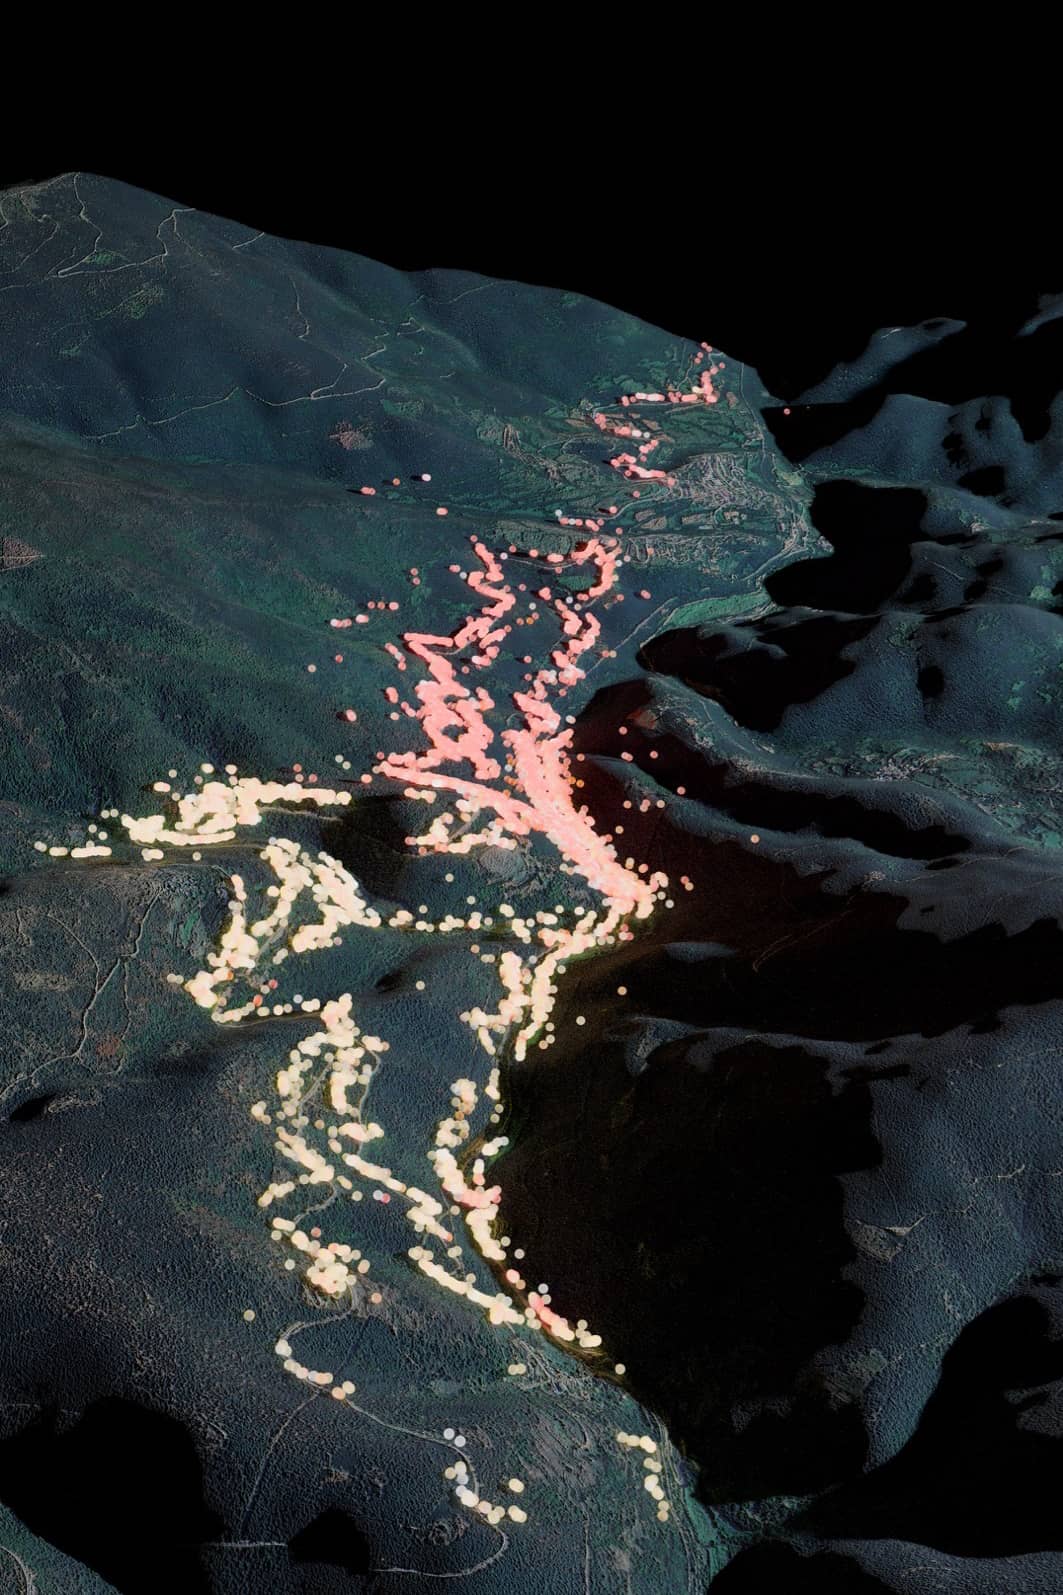
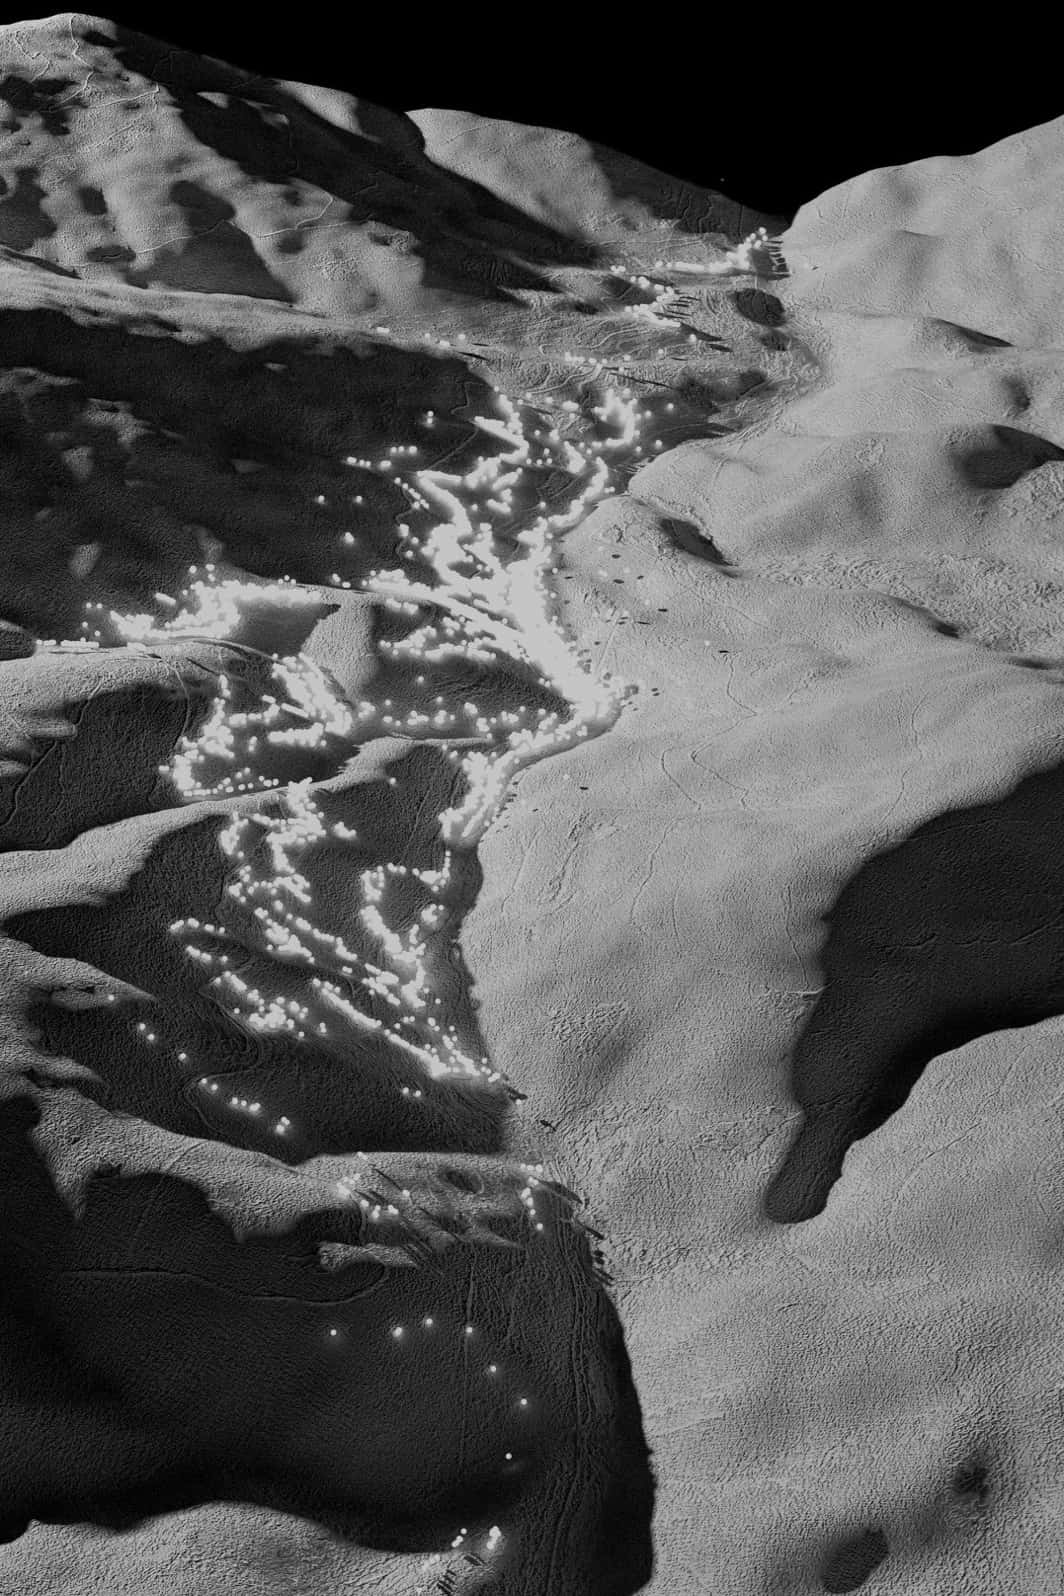
To build that experience, we worked across archival footage from the Barton Group's field trips, custom 3D scans of the flowers, and data visualisations that moved between faithful representation and deliberate artistic interpretation. Each choice was made in service of a single question: does this help a viewer feel the significance of what they are looking at?
The animation moves at the rhythm of the research itself — circling the landscape at a macro level, then zooming into individual blossoms and the data points clustered around them, then pulling back out again to show the population as a whole. It is the same movement a scientist makes: between the single specimen and the pattern it belongs to, between the close and the vast.
Credits
Work realised for and with Process Studio
Done in collaboration with Stefan Schönauer.


